| Quick tutorial | ||||||
| System Requirements | ||||||
| Description of interface | ||||||
| Input data | ||||||
| Connection to a database | ||||||
| Query forms to add/filter/color a graph | ||||||
| Add Interactions | ||||||
| Expand nodes | ||||||
| Filter a graph | ||||||
| Color a graph | ||||||
| Layout a graph | ||||||
| Node and edge information | ||||||
| Save options | ||||||
| Deployment | ||||||
Color graph
|

![]()
Center for Molecular Medicine and Genetics
Wayne State University School of Medicine
540 E. Canfield
Detroit, MI 48201
![]()
| IM Browser Manual | ||||
|
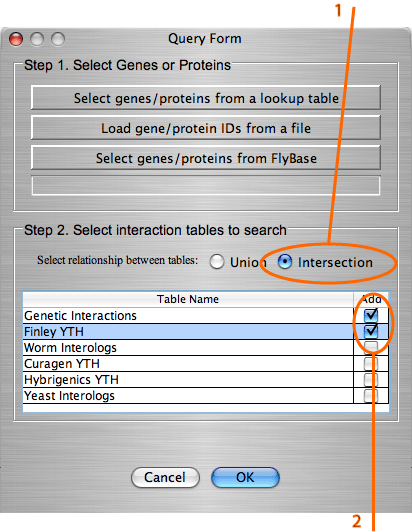
Add intersection/union of the tables. IM Browser query forms provide two radio buttons: "Union" and "Intersection". With the selected “Union” button the interactions that are found in at least one of the selected tables will be added to the graph. With the selected “Intersection” button, only interactions that are common to the selected tables will be added to the graph. Example: Build a graph of interactions common in tables "Genetic interactions" and "Finley YTH".
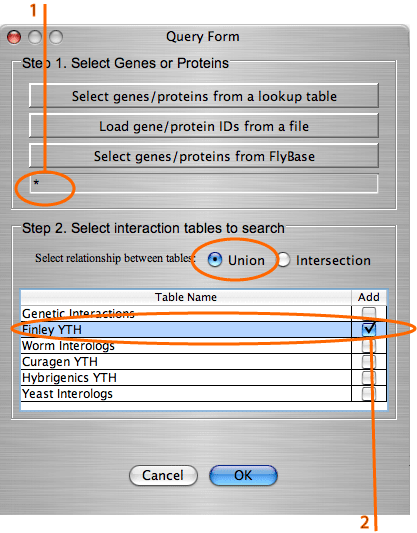
Example: Build a graph with all the interactions from table "Finley YTH".
|