| Quick tutorial | ||||||
| System Requirements | ||||||
| Description of interface | ||||||
| Input data | ||||||
| Connection to a database | ||||||
| Query forms to add/filter/color a graph | ||||||
| Add Interactions | ||||||
| Expand nodes | ||||||
| Filter a graph | ||||||
| Color a graph | ||||||
| Layout a graph | ||||||
| Node and edge information | ||||||
| Save options | ||||||
| Deployment | ||||||
Color graph
|
![]()
Center for Molecular Medicine and Genetics
Wayne State University School of Medicine
540 E. Canfield
Detroit, MI 48201
![]()
| IM Browser Manual | ||||||||
|
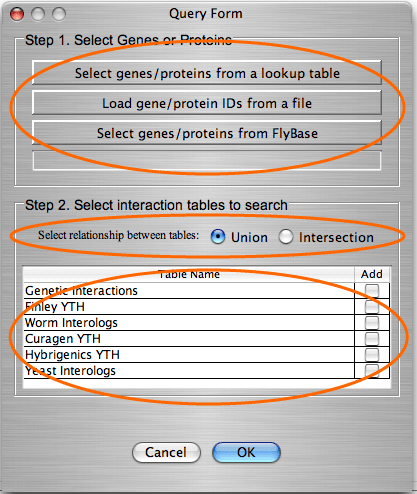
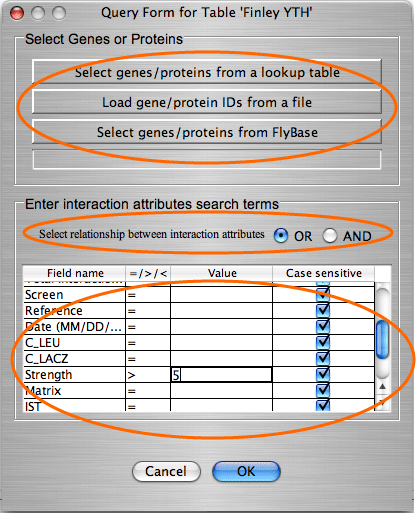
Query forms to add/filter/color a graph. The user communicates with the database through the query forms. IM Browser provides one form for searching multiple tables and another form for searching a single table. These two query forms are used to add/delete/color interactions to/from the graph.
For examples of how to use the query form for multiple tables, click here. For examples of how to use the query form for a single table, click here. We also have a quick tutorial with the step-by-step instructions on how to search and add interactions to the graph based on gene/protein attributes. If you learn how to add the interaction, you will also know how to filter and color a graph by gene/protein attributes. |
||||||||


